
5.04% increase in sales per session thanks to new personalization strategy at Outletcity Metzingen
Outletcity Metzingen puts its personalization strategy to the test and increases revenue per session by 5.04%.
Product recommendations aim to showcase suitable products that inspire customers and ultimately lead to a higher shopping cart value. To achieve this, self-learning algorithms and regression trees are needed to calculate a suitable rule for each individual situation. The rule chains should always be optimized for the respective situations, thereby generating more revenue. We will show you how this works in the third part of our blog series Reinforcement Learning Process.

Here's what you can expect to find in this blog article:
What does a rule for recommendations look like?
Rule generation with self-learning algorithms using regression trees
What is a regression tree?
What data does a regression tree use to generate recommendations?
Example: Predicting the number of brands using Anna as an example
The structure of a regression tree offers billions of possibilities
The development of the basic structure of a regression tree
Conclusion: Using self-learning algorithms and regression trees to increase sales
First, we would like to clarify how the agent proceeds in order to precisely define rules for recommendations using self-learning algorithms. These allow him to influence e-commerce recommendations on every newly accessed page of an online store.
To do this, we will look at what a rule from a rule system might look like: "Only show products from the x brands that the customer has viewed most frequently." The x can take the values 1, 2, or 3, as well as ∞. In this case, ∞ means that the recommendations are not limited to specific brands.
Once a rule has been established, the agent uses self-learning algorithms to determine when which value of x is most appropriate. The agent makes this decision based on individually tracked user data. This means that it can make different decisions for brand-conscious customers than for customers who do not have any discernible brand preferences.
Stay up to date on personalization: Sign up for the Epoq newsletter. Register now!
Below, we show you the model used by self-learning algorithms to establish rules and how our agent uses them to make relevant recommendations.
First, we need to determine the value x for our example rule regarding the number of brands. The goal is to achieve the highest possible sales. So we set out to find the ideal value for x for each individual situation.
To achieve our goal , the agent creates a machine learning model once a day . This model allows him to predict which values are most suitable in which situations. This requires an approach that accurately predicts expected sales based on customer history. Regression trees are part of a suitable machine learning model for these predictions. The advantages of this are:
That sounds good so far. But how can you imagine a regression tree? The structure is similar to a category tree in an online shop, which is used to subdivide products. Here, you can subdivide the product categories multiple times. For example, shirts and blouses both belong to the category of outerwear. However, shirts can be subdivided in more detail, e.g., into polo shirts and long-sleeved shirts.
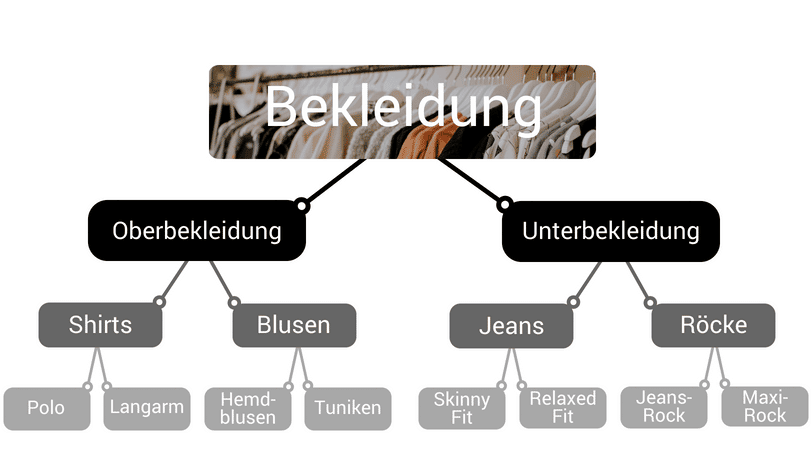
Example structure of a category tree for an online shop
To find out how many brands should be displayed, our agent has to work its way through the regression tree. Here, the tree is not divided into clothing categories, but rather according to the recorded tracking data. The individual data consists of a vector with information about a user's sessions. This could be information about the number of different product detail pages that the customer has viewed, for example. Information about how long they have been on the website and whether they are looking at high-quality or inexpensive products can also be included. In addition, there is data from the past. This contains information about how the agent has decided in the past and how much the customer spent at the end of the session.
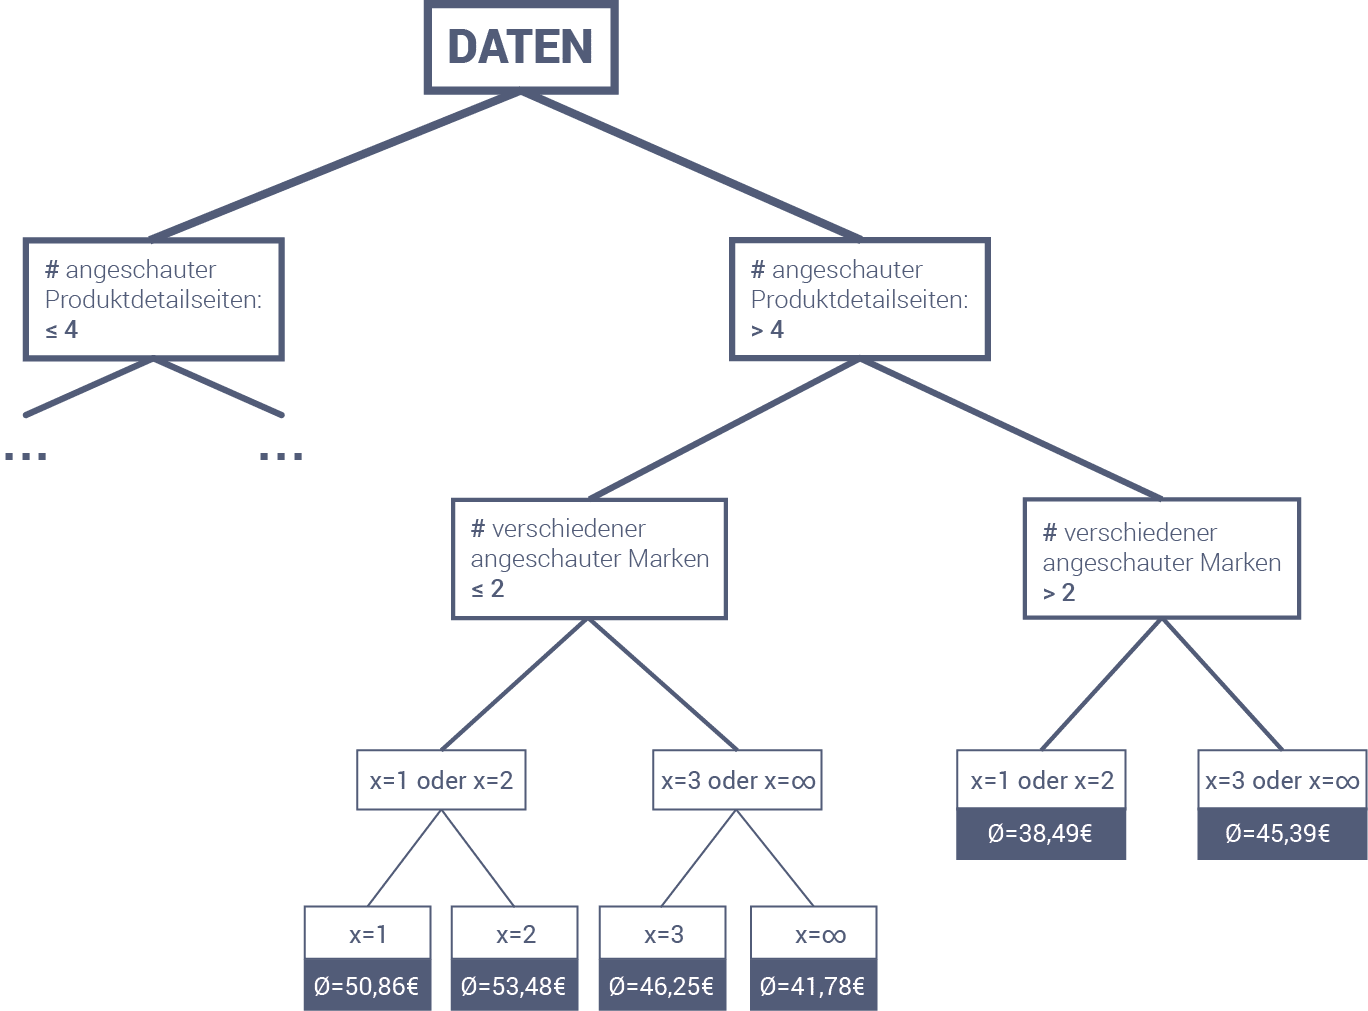
Let's now go through the example with the number of brands using the regression tree shown below. To do this, we'll look at customer Anna. She has just viewed a jacket that costs $89.99. The agent must decide how many brands to recommend to her in order to generate the highest possible sales. Anna has already viewed seven different product detail pages for two different brands.
Based on this information, we must first choose the right branch and then the left branch. The next decision concerns the number of brands displayed. This is precisely what the agent does not yet know, but wants to investigate. He therefore follows both paths to see what the outcome will be. At the next level, he must again decide based on the number of brands displayed. This time, the decision is even more granular. Here, too, he follows all possible branches.
At the end of the regression tree, he receives the following estimates: If he chooses exactly one brand, he can expect an average revenue of $50.86 for customer Anna. If, on the other hand, he chooses two different brands, he can expect slightly higher revenue, namely $53.48. This is also more than the €46.25 and €41.78 for three and any number of brands, respectively. The expected revenue is therefore highest for two different brands. This is then the decision that the agent makes. The actual recommendations for Anna can then be calculated and sent to her browser.
The example with Anna is a significant simplification. The trees that are actually used for product recommendations are much more granular. This means that they have many more branches, go into greater depth, and consider more features from the respective session. Nevertheless, the servers only need a few milliseconds to search the tree.
The next question that arises here is how well a regression tree is constructed. There are billions upon billions of ways to compile the individual decisions for the tree. Not all of these possibilities are equally good. For the tree's predictions to be accurate, it must be well constructed. We can test how well a tree is constructed using historical customer data. The better the tree, the smaller the deviations between actual sales and those predicted by the tree.
Stay up to date on personalization: Sign up for the Epoq newsletter. Register now!
To create the best possible trees, we use self-learning algorithms. This means that we make decisions for the trees based on the session data collected, rather than on human opinions. We start with an empty tree and then gradually add decisions to it. A decision consists of two pieces of information. First, you have to choose a feature (number of product detail pages viewed, number of brands viewed, time spent on the website, etc.), and second, a number c that serves as a cutoff: all sessions with a value less than or equal to c go to the left, all others go to the right.
Next, for each feature, the system calculates which c-value best ensures that the resulting predictions are closest to the actual sales. You can then check which pair of features and c-values works best and decide on a feature. Once you have added a decision to the tree in this way, you can continue with the next decision. This procedure is continued until the tree is sufficiently developed.
Self-learning algorithms and the regression tree model are required for establishing rules. Compared to rigid strategies, decision trees offer an ideal way to respond to the individual and constantly changing situations of online shoppers. This is because decision trees allow the agent to make decisions based on the current status of the online shopper. In addition, decision trees can be continuously optimized using self-learning algorithms. This allows strategies to be pursued that support the achievement of maximum sales value for each online shopper.
The first part of our blog series "Reinforcement Learning Process": How to use reinforcement learning profitably for your online shop (Part 1)
And here's the second part: How to increase the probability of purchase with real-time analytics (Part 2)
5.04% increase in sales per session: Outletcity Metzingen has put its personalization strategy to the test.
Request the case study now!

You are currently viewing placeholder content from HubSpot Embedded Content. To access the actual content, click the button below. Please note that doing so will result in data being shared with third-party providers.
More InformationYou are currently viewing placeholder content from HubSpot. To access the actual content, click the button below. Please note that doing so will result in data being shared with third-party providers.
More InformationYou are currently viewing placeholder content from HubSpot Meetings. To access the actual content, click the button below. Please note that doing so will result in data being shared with third-party providers.
More Information