
10x higher e-commerce sales through personalized and automated email campaigns at Ex Libris
Working with Epoq, Ex Libris increased its e-commerce revenue tenfold through personalized and automated email campaigns.
E-commerce analytics help you to continuously optimize your online store. If you have ever thought about evaluating changes to your online store in terms of the revenue they generate, then this article will be helpful for you. However, if you only use figures as decorative embellishments because the decisions you need to make are based on other criteria, then you will probably find this article rather boring.

Here's what you can expect to find in this blog article:
E-commerce analytics requires statistics
Why sales and not conversion rate?
Stumbling blocks in interpreting sales figures
Obstacle 1: Mirage tendency
Stumbling block 2: Luck or skill – outliers
Stumbling block 3: No basis for calculation
To quantitatively assess the quality of an online store and make decisions, we look at numbers and perform e-commerce analytics. We call these numbers KPIs(key performance indicators) or business metrics. Unfortunately, numbers can also be misleading...because discovering patterns or connecting cause and effect is more in our nature than recognizing coincidences. Some of the following examples will surely sound familiar to you:
Stay up to date on personalization: Sign up for the Epoq newsletter. Register now!
When it comes to sales figures in particular, there is a high risk of becoming a "victim" of your own gut feeling. This is because sales figures vary much more than, for example, a click rate—you either get a click or you don't. So, in order to increase the reliability of figures, we need to counteract our all-too-human gut feelings. This is where statistics come in. They may be boring, but they are necessary.
A/B testing has become a widely accepted method in e-commerce analytics for testing whether changes to an online store actually result in improvements in relation to predefined KPIs.
The KPI that is commonly discussed everywhere on the internet is theconversion rate. This has the advantage that it is quite easy to determine. For example, by counting the visits to the online shop that result in a purchase. However, the problem with the conversion rate is that, although it can measure the number of purchases, it says nothing about the revenue generated. This is unsatisfactory in that the revenue generated is ultimately the decisive factor.
Is your only goal to increase your conversion rate? Then I recommend simply lowering your prices. Whether this will still have a positive effect on your bottom line is another question.
One thing is certain: sales must be included in an A/B test. There are various approaches in the field of e-commerce analytics for measuring sales:
In the following, we’d like to use examples to highlight three common pitfalls that can arise when interpreting sales data in e-commerce analytics. For data protection reasons, the following examples are all fictional but based on real tests conducted with and at Epoq. At the end, we’ll also answer the question of which of the revenue metrics mentioned above is best suited for A/B testing.
Here you can see a graph showing the figures for the first 5 days of an A/B test. The average shopping cart value per day is displayed. The number of shopping carts sold in groups A and B is the same:
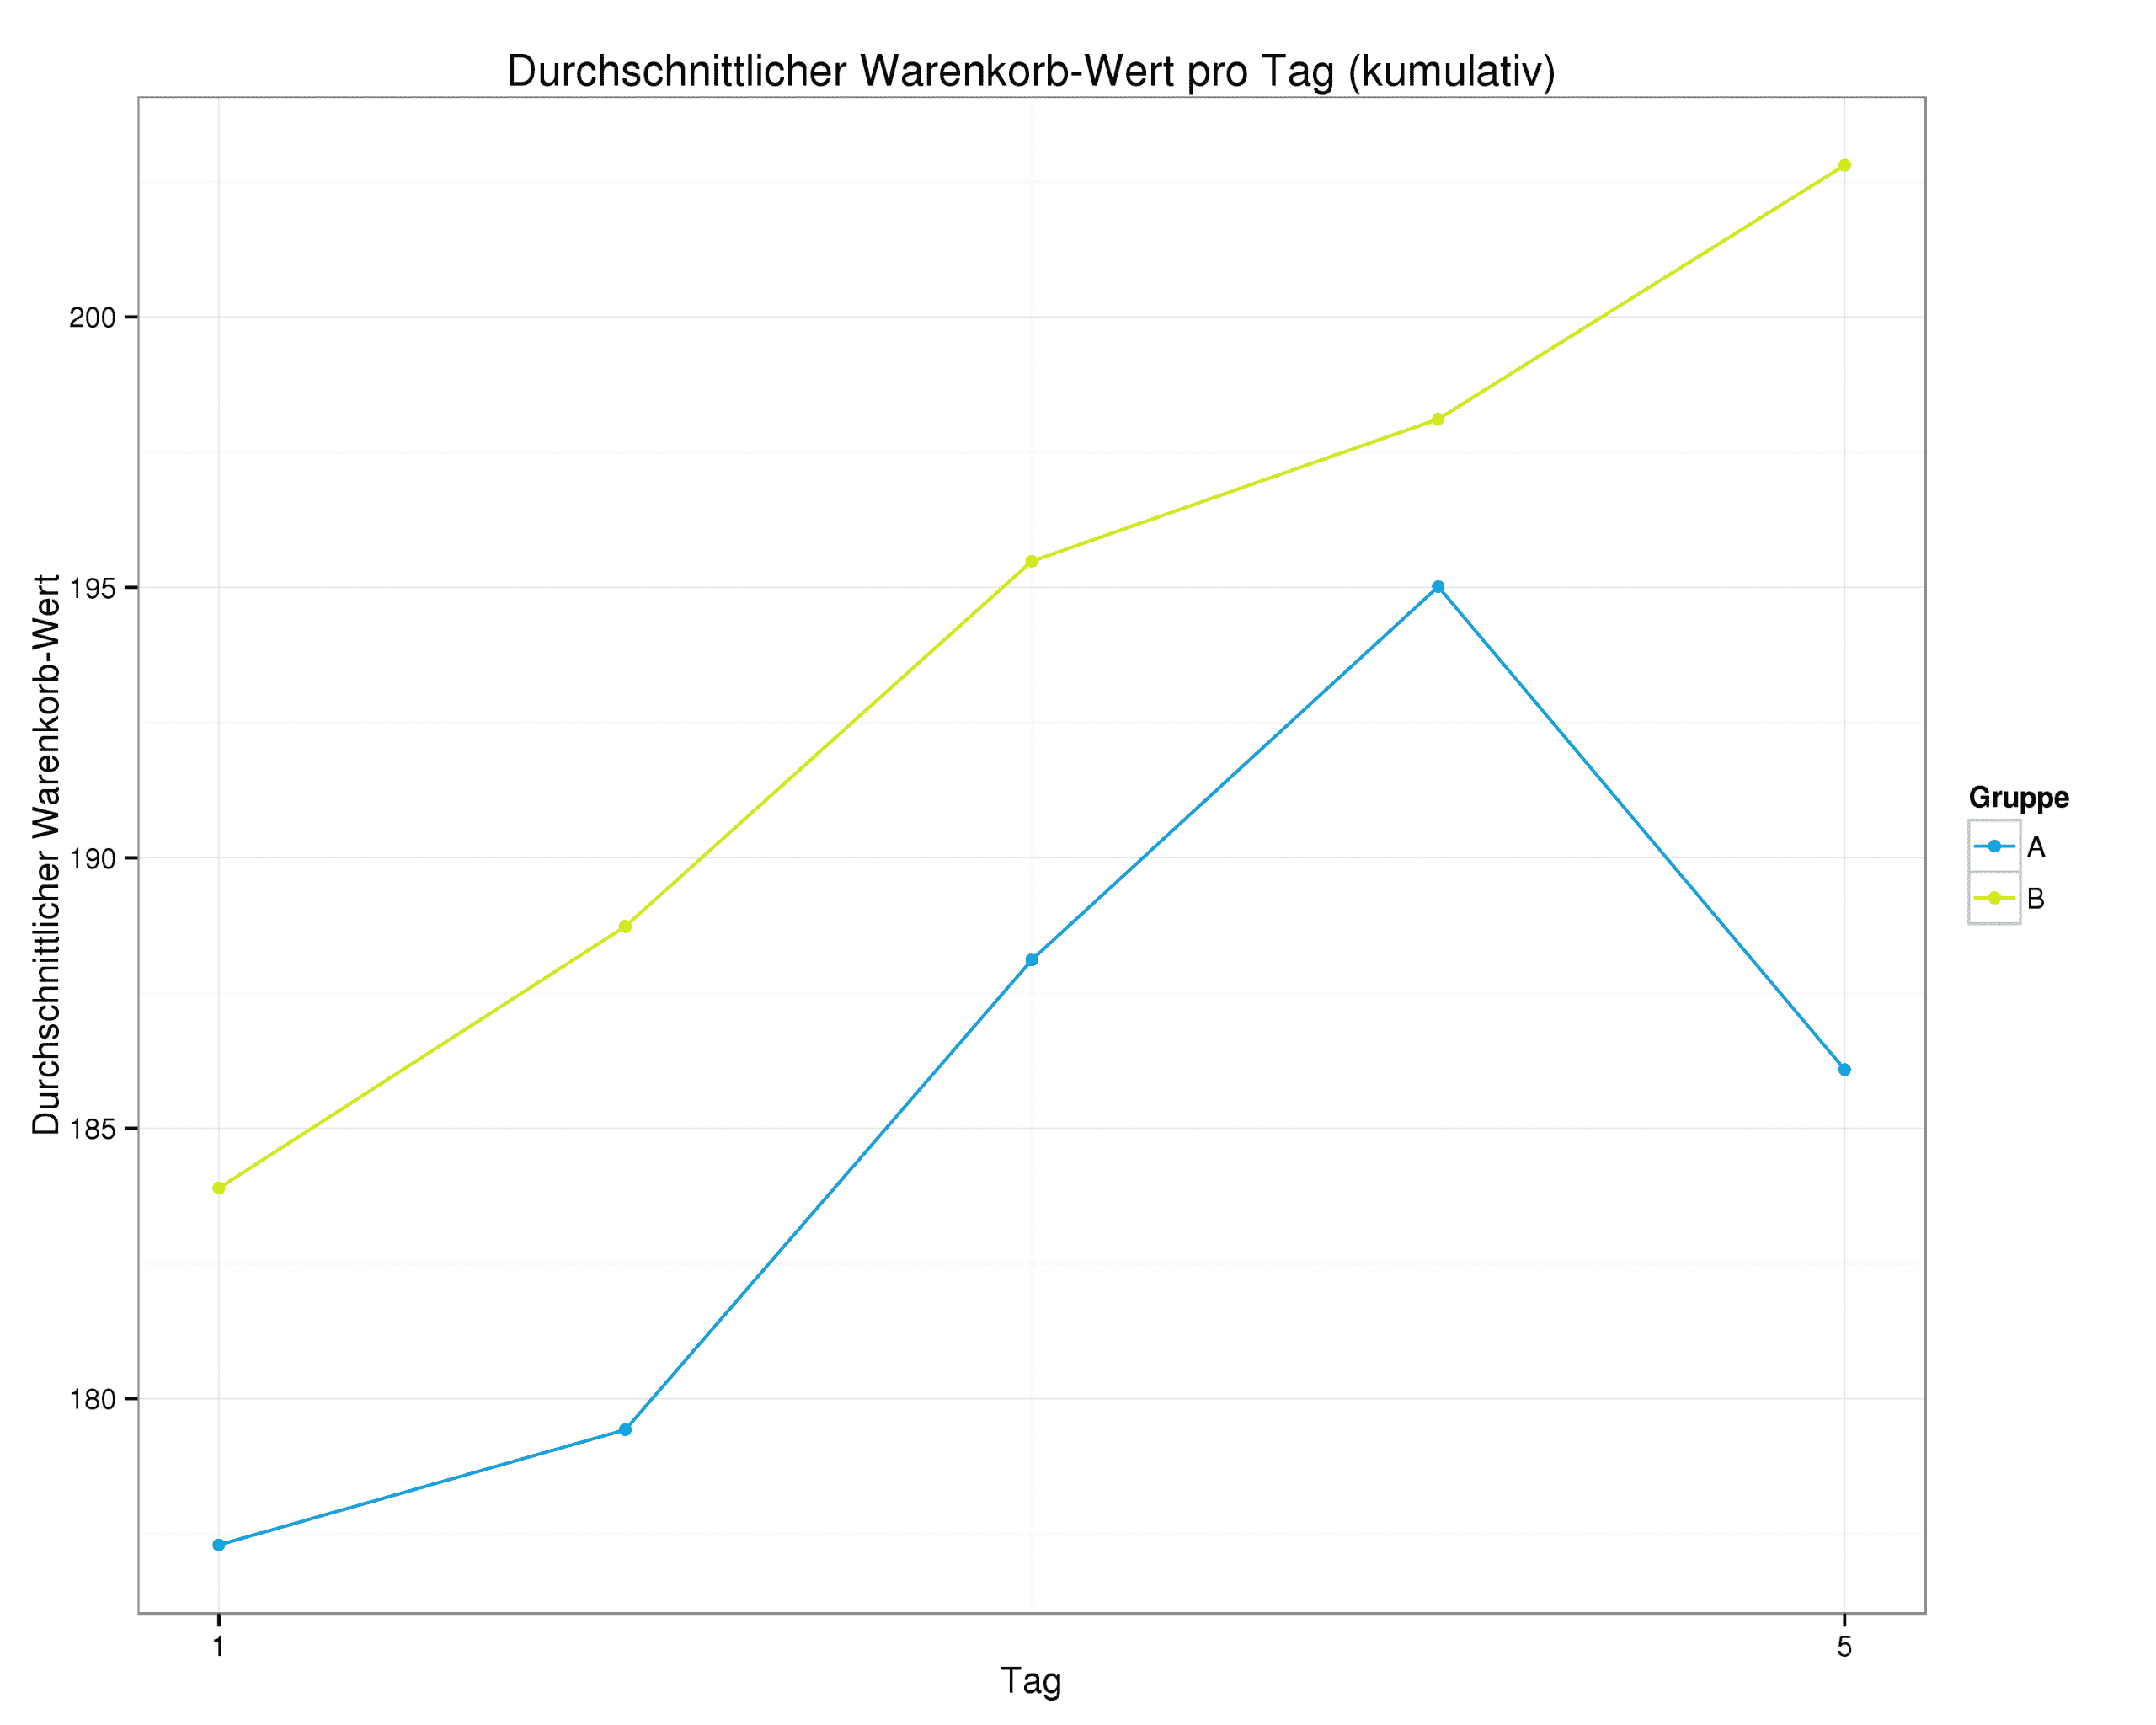
Graph showing the average shopping cart value up to the 5th day of the A/B test
It looks pretty clear. On day 5, group B with the green line is already 4.6% better than group A with the blue line. So you could actually stop the test now, right? But in fact, the test continues as follows:
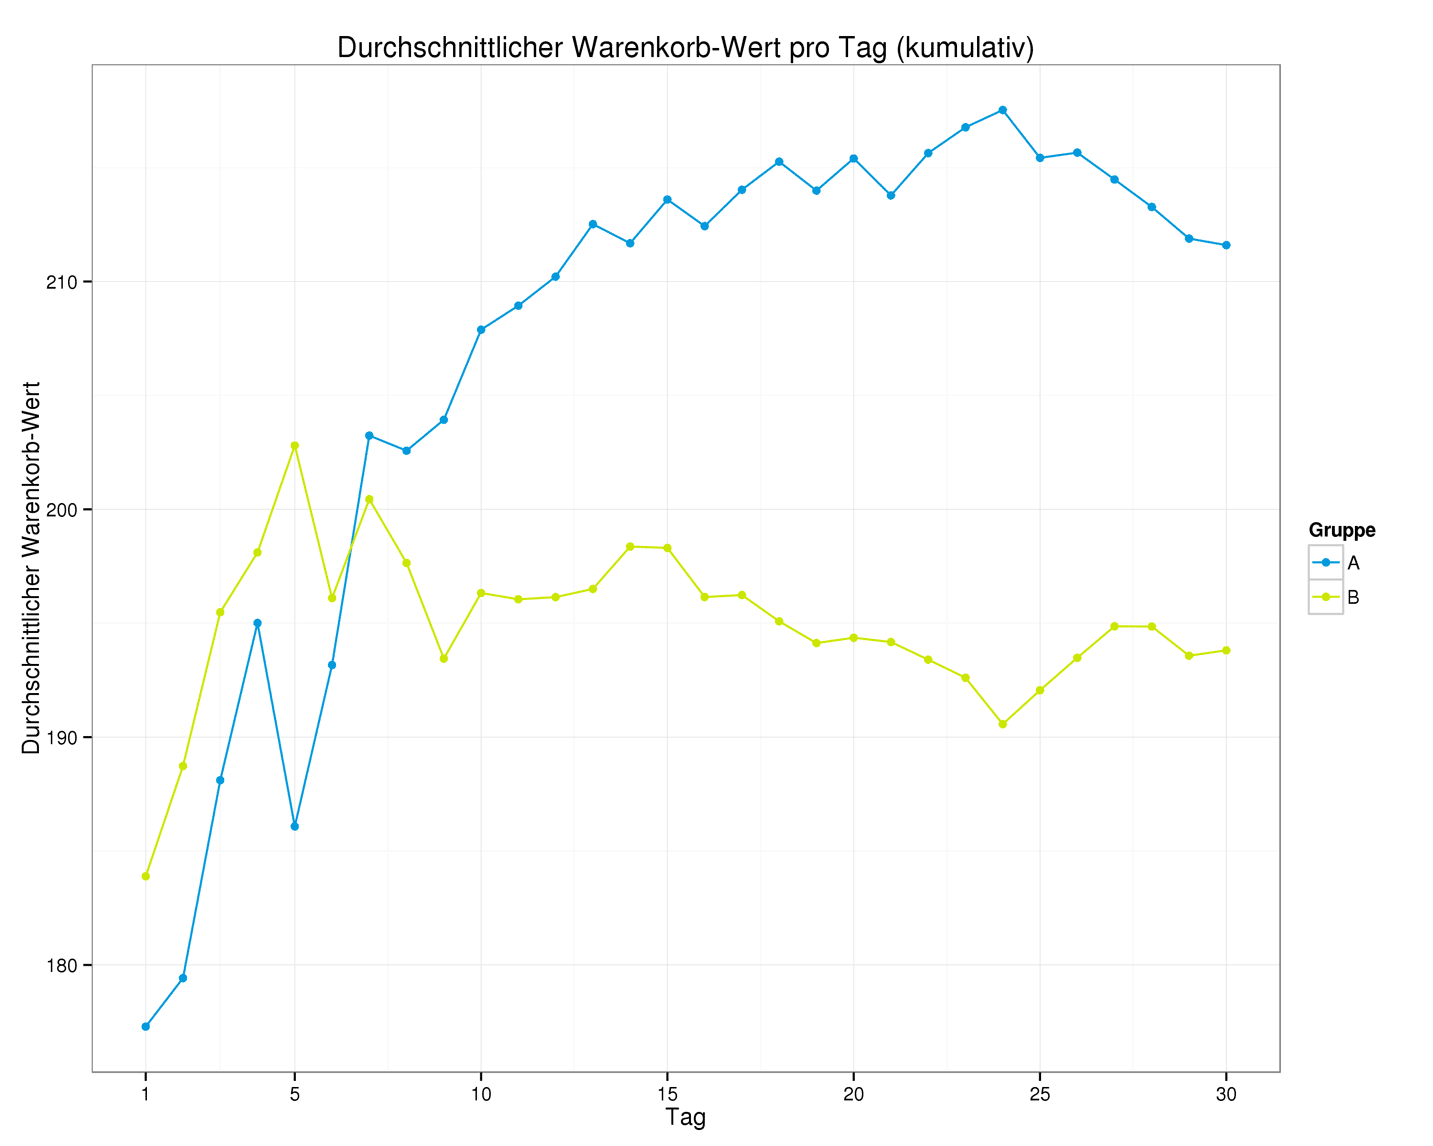
Graph showing the average shopping cart value after the 5th day of the A/B test
After 30 days, Group A with the blue line is almost 10% better. But what happened here? This is a random statistical effect. Even if one group is better than another on average, individual shopping cart values may occur that make the other group look better in the short term. As mentioned at the beginning, we humans are better at recognizing patterns than coincidences. We simply continue the curve in our minds. In fact, it is not uncommon for the winning group to be behind at the beginning of the test.
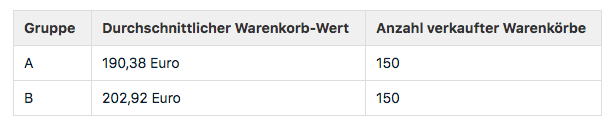
Here is a table showing the current status of an A/B test for the KPI "Average shopping cart value":
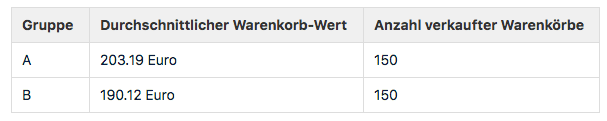
Average shopping cart value of the A/B test
Group A is thus almost 7% better than B. That looks pretty clear again. So should we switch off the A/B test? No, there is a stumbling block here too. However, you only see this when you look at the individual shopping carts or the distribution of shopping cart values in both groups:
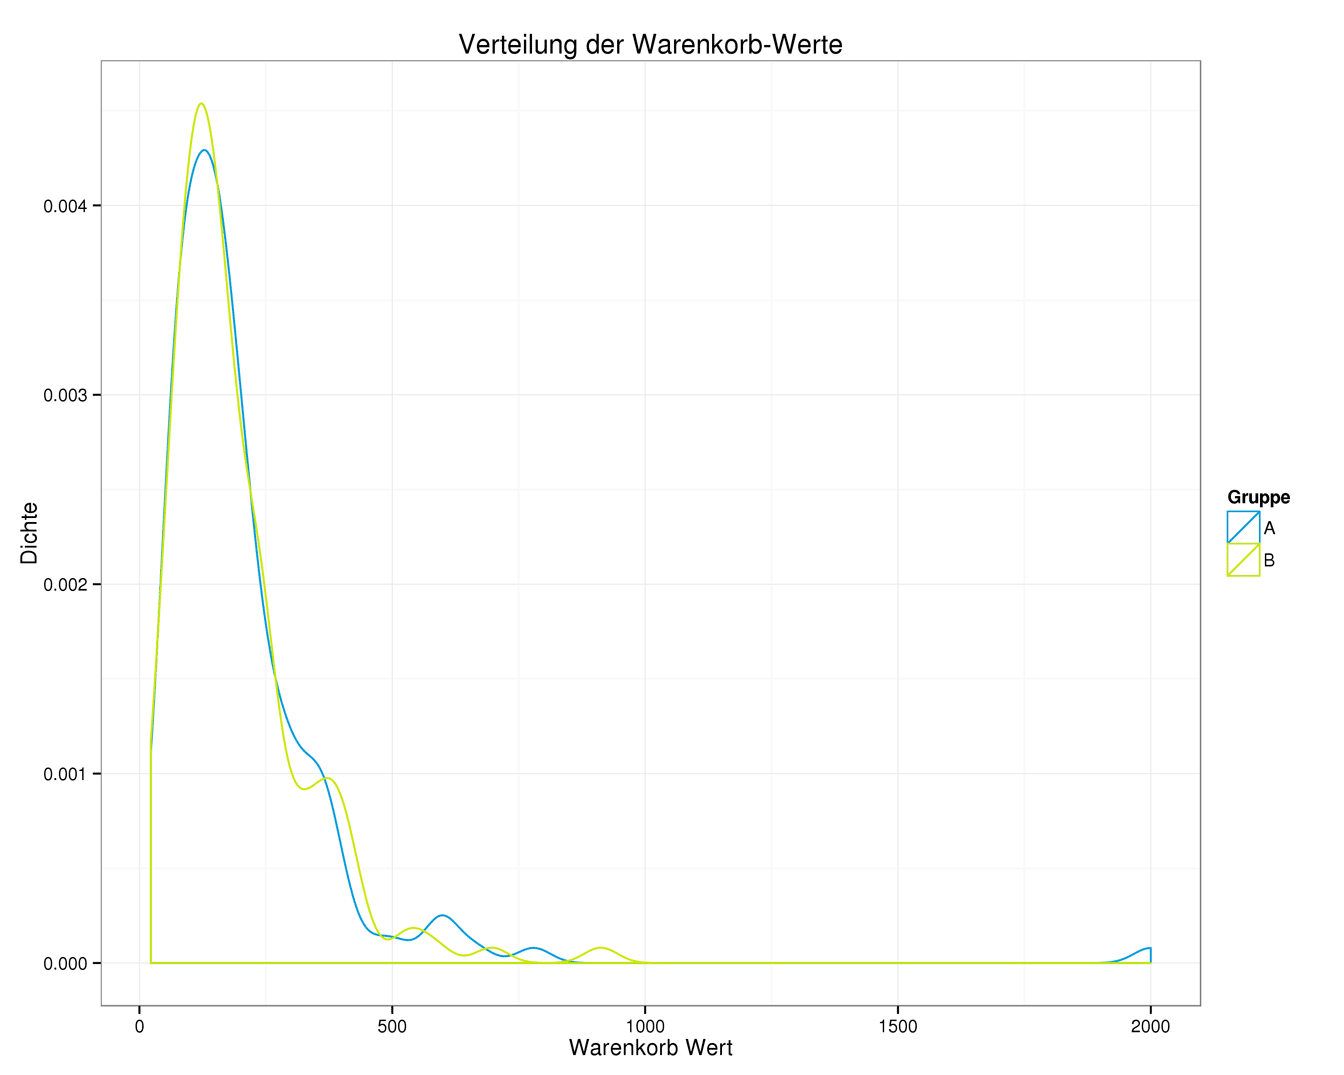
Shopping cart values of the A/B test with illustration of the exception (blue hill on the right)
For this graph, it is sufficient to understand the following: the higher the curve, the more shopping carts were sold at the value shown on the horizontal x-axis. The shopping cart values for group A and group B occur with almost equal frequency. However, do you see the small blue hill on the right-hand side? This represents a shopping cart value of €2,000 and is therefore an exception.
Is this value responsible for Group A performing better than Group B? Let's try it out and simply swap the maximum values for both groups. Group B gets the €2,000 shopping cart and Group A gets the largest shopping cart from Group B, worth around €779. The table above now looks like this:
Average shopping cart value of the A/B test with exchanged maximum values
Group B is 6.5% better than group A. The picture has completely changed.The extreme value alone determines which group is the "winner." In statistics, such extreme values are referred to as outliers.
But what does that mean for us? In our case, the outlier could be a customer who buys everything she likes from the current collection once a season. This customer is a one-off case, albeit a nice one for the retailer. She "burst into" the current A/B test and wasrandomlyassigned to group A. However, this does not say anything about whether the selected change in the online shop behind group A actually manages tosystematicallygenerate such high shopping cart values.
You may be familiar with this from sports: if a soccer player manages to score a direct free kick, it's probably just luck. But if he manages to do it several times per season, he's clearly "got what it takes."
We are once again looking at the evaluation of an A/B test, this time at the KPI total revenue:
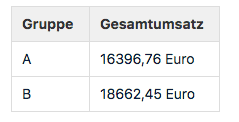
Evaluation of A/B test based on total sales
Group B clearly comes out on top with an increase in sales of almost 14%. However, if you've followed this article this far, you know that the story doesn't end there. Something is missing from the table. Can you see what it is? That's right: the number of units/shopping carts sold. With the shopping carts added, the table looks like this:
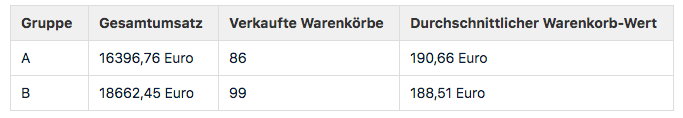
Evaluation of A/B test based on total sales and supplemented by the average shopping cart value
"That's all well and good," I hear you say, "but why should I care about the average shopping cart value? Group B sold more shopping carts and generated more revenue, so that's fine!" That's right. For this reason, we also look at the number of shop visits and the associated KPIs,conversion rate, andrevenue per shop visit:
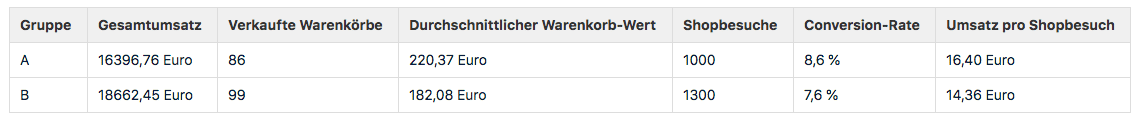
Evaluation of A/B test based on total sales, average shopping cart value, number of shop visits including conversion rate, and sales per shop visit
"More numbers," I hear you say again, "but Group B still generates more revenue!" That's right, Group B generates more revenue in absolute terms. But measured by the number of shop visits, i.e., the size that is split 50/50 in an A/B test, Group B generated less revenue. Why is this so important in practice?
Shop visitors are randomly assigned to groups A and B. It is therefore perfectly natural that sometimes one group has more visitors than the other and, as a result, generates more sales. Compare the allocation to tossing a coin: if you toss it 10 times, you won't always get 5 heads and 5 tails, but sometimes 7 heads/3 tails, 4 heads/6 tails, etc.
For you, this means that sales can only be compared on the same basis. Otherwise, the random mechanism used to divide the groups will ultimately decide who wins the A/B test. Let's normalize the value in the rightmost column to 1,000 visits to make it clear:
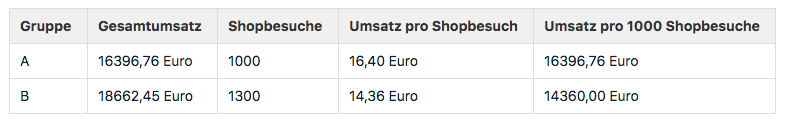
Sales A/B test normalized to 1,000 store visits
If you use the same calculation basis, the result changes again. So what is the correct sales KPI? In summary, it can be said thatthe KPI sales per visit is the most meaningful indicator of total sales. If you can demonstrate an increase in this KPI in an A/B test, you have also increased total sales.
Stay up to date on personalization: Sign up for the Epoq newsletter. Register now!
E-commerce analytics offers you ways to avoid these pitfalls. As we have seen, pitfall 3 is easy to avoid by choosing a better KPI. Pitfalls 1 and 2, on the other hand, can only be avoided if you have a good statistical analysis program at your disposal. This must take into account uncertainties caused by insufficient data and/or potential outliers. This prevents a winner from being announced prematurely who may not actually be the winner. Tests may take a little longer on average, but in my opinion, a correct decision is still better than a quick but potentially wrong one.
In order to evaluate changes in the online shop using e-commerce analytics, it is essential to consider sales figures in an A/B test. The best metric for this is revenue per visit. Good statistical programs are necessary to be able to counter gut feelings with reliable figures.
Discover how Ex Libris is boosting e-commerce sales
Read the case study now!

You are currently viewing placeholder content from HubSpot Embedded Content. To access the actual content, click the button below. Please note that doing so will result in data being shared with third-party providers.
More InformationYou are currently viewing placeholder content from HubSpot. To access the actual content, click the button below. Please note that doing so will result in data being shared with third-party providers.
More InformationYou are currently viewing placeholder content from HubSpot Meetings. To access the actual content, click the button below. Please note that doing so will result in data being shared with third-party providers.
More Information